Pinnacle’s performance reached new heights.
We continued to execute at a very high level on virtually every critical success measure for our firm. In 2021, Pinnacle produced top-quartile total shareholder returns against our peer group with underlying impressive growth in loans, deposits, fees, EPS and tangible book value per share.
Share price
Our stock reached a major milestone in 2021, crossing $100 per share in October. The shareholder returns have been outsized compared to peers from the beginning and over 10-year, 5-year, 3-year and 1-year time horizons.
| Since IPO | 10 Year | 5 Year | 3 Year | 1 Year | |
|---|---|---|---|---|---|
| PNFP | 1,810% | 491% | 188% | 107% | 48% |
| KRX | 176% | 153% | 13% | 41% | 33% |
| Out-Performance | 1,634% | 338% | 175% | 66% | 15% |
As of Dec. 31, 2021
Loans
Excluding the impact of PPP, we achieved loan growth of 11.7 percent. Replacing PPP revenue will be a function of new loan growth in 2022, and we believe we have the infrastructure in place to make that happen.
Fees
Our SBA and Wealth Management teams, which include investment, trust and insurance services, as well as the firm’s investment in BHG, outperformed in 2021. Noninterest income increased 24.7 percent year over year.
Earnings per share
Despite a volatile and challenging operating environment, we ended the year with earnings per diluted common share of $6.75, an increase of 67.5 percent over 2020.
Deposits
Deposits grew to $31.3 billion by year-end 2021, up 13 percent over Dec. 31, 2020. We saw double- or triple-digit growth in FDIC deposit market share in 12 of our markets, as of June 30, 2021. We were one of the top five biggest banks in terms of deposits in seven MSAs and remained the No. 1 bank in Nashville for the fourth year in a row.
Tangible book value per share
Pinnacle’s tangible book value per share increased from $37.25 at the end of 2020 to $42.55 at year-end 2021. We intensified our focus on this metric by adding a peer relative performance component tied to it in our leadership’s equity compensation plan. Our leaders win if our tangible book value per share growth, ROTCE and total shareholder return outperform in relation to our peers. We believe the program’s design appropriately links management with shareholders.
For full financial data, including GAAP and non-GAAP measures, see our Business Insights.
We have succeeded in metrics across the board.
Margins
We’ve been very successful on both sides of the balance sheet in keeping our pricing competitive and maintaining margins in a difficult environment.
PPP
The Paycheck Protection Program has been a significant contributor to our success, both from a client service perspective and financial perspective.
Recruiting
We hired 119 revenue producers, setting a record for attracting and hiring experienced financial services professionals away from the larger, more vulnerable institutions in our markets.
BHG
Income from Bankers Healthcare Group grew by 46% in 2021. Today, BHG has nearly 1,400 banks in its network, and more than 700 individual banks acquired BHG loans in 2021. Our outlook for BHG continues to reflect outsized fee income growth of approximately 20 percent in 2022.
Credit
Pinnacle’s asset quality has continued to hold up. Our loan portfolio performed very well in 2021—in fact, we saw some of the best credit metric ratios we’ve experienced in our history. We reduced our allowance for credit losses to total loans (excluding PPP loans) from 1.38% at year-end 2020 to 1.14% at Dec. 31, 2021, a decrease of 24 basis points.
We have invested in sustainable growth.
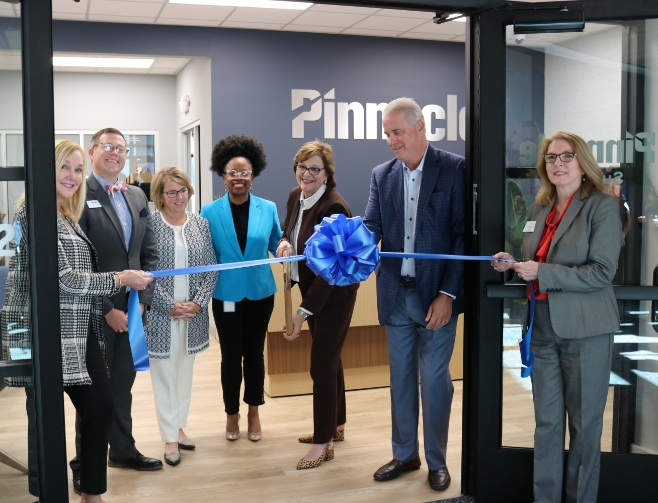
In recent years we have invested meaningfully to position the firm to continue its rapid growth. Our Atlanta team, which launched in early 2020, finished the year with 46 associates in two offices and a third on the way. In an effort to replicate that success in other high-growth Southeastern markets, we expanded to several new locations in 2021—Birmingham, Huntsville and the Washington D.C. area.
Our new markets, including Atlanta, and our new specialty lending teams accounted for approximately $530 million in loan growth in 2021. We believe that our emerging markets, including the National Capital region in the Washington, D.C. area, should contribute 2-3 times that amount in 2022.
We continue to balance that investment in future growth with appropriate spending, as evidenced by a noninterest expense to asset ratio of just 1.85% in 2021. Much of the increase in expenses was a result of our continued investment in our associates. They consisted primarily of salary costs and incentive accruals, which correlate positively with earnings. We were elated to deliver an outsized incentive to our associates for the extraordinary results they achieved in 2021. As we designed from the beginning, every non-commissioned associate participates in the firm’s cash incentive plan. We win together and lose together.
In 2021, we won together.


